The Dashboards section describes research done on a given subject relevant to pandemic preparedness research by researchers affiliated with a Swedish research institute. Specifically, in our case we write about COVID-19 and SARS-CoV-2, infectious diseases in general, antibiotic resistance, enteric viruses and Mpox. The goal is to highlight and visualise openly shared data that can potentially be used by many other researchers to make further discoveries.
To easily find dashboards relevant to a specific topic, simply click on the colored tag and the page will filter and display only the dashboards related to that topic.

The COVID Symptom Study Sweden (CSSS) collects data on COVID-19 prevalence, symptoms, and vaccinations through a smart phone app with over 200.000 users in Sweden. Raw data can be requested for use in research projects.

A summary of the COVID-19 and SARS-CoV-2 publications produced involving at least one contributor from a Swedish university or research institute. Shows publications over time and key words/phrases within them.

CRUSH Covid maps outbreaks in Uppsala County by visualising the number of cases, test positivity, and geographic distribution, among other things. Data for each postal code is available for download and reuse.

A summary of the progress in developing a multi-disease serology assay, a key component of pandemic preparedness. Information about externally produced antigens is also provided.
The national Pandemic Centre (NPC) conducted testing related to SARS-CoV-2 from the start of the pandemic. They show positive, negative, and inconclusive tests. This dashboard is historic, so no longer updated.

The Swedish Board of Health and Welfare (Socialstyrelsen) shares data on Post COVID-19 condition. Here, we show visualisations of data on symptoms, healthcare contacts, and geographic distribution, among other things.
Dedicated to the work of the register-based large-scale national population study to monitor COVID-19 vaccination effectiveness and safety (RECOVAC) project.
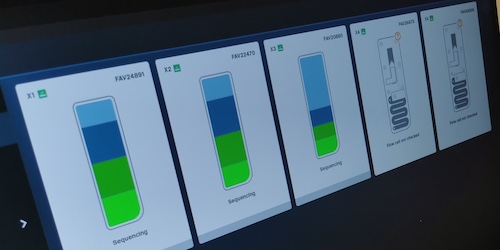
Surveillance of viral genome sequences is crucial in tracking the spread of viral variants. This dashboard shows whole-genome sequencing data generated by Uppsala University Hospital.

The dashboard displays the SARS-CoV-2 serology tests completed over time at the at SciLifeLab Autoimmunology and Serology Profiling unit. The number of tests in total and the amount of positive/negative tests over time are shown.
The Swedish Health Agency (Folkhälsomyndigheten) provide data and information related to COVID-19 in Sweden. Visualisations are shown on multiple aspects of vaccination coverage, like coverage in different counties.

Surveillance of wastewater for pathogens can be an effective means of predicting upcoming outbreaks. This dashboard contains data originating from the multiple research groups across Sweden.